North American MW Coverage Maps
USA, Canada AM radio antenna patterns
Many MW broadcasters use antennas with directional radiation patterns in order to focus their signal on to a particular geographical area. This serves two purposes. Firstly it avoids radiating an expensive signal in a direction where there are few listeners. Secondly it avoids beaming a signal towards another station where listeners might experience interference between two signals. Thirdly a directional radiation pattern allows a station to focus its energy on a distant target audience.
Background to antenna patterns
Radio engineers have known for many years how to create broadcasting antennas with a directional pattern but they inevitable are more complex and expensive than a simple antenna that radiates omni-directionally (i.e in all directions). These antennas also need careful maintenance to maintain their design performance.
In countries like the USA there was huge growth in demand for AM radio stations in the 20th century. The challenge was to ensure that 50kW “clear” channel stations could co-exist with 1kW small town stations without filling the MW radio dial with lots of mutual interference. Directional broadcast antennas have been in use from the early 1930s and today many sophisticated antenna arrays exist across North America, and to a lesser extent on other continents.
Inevitably the use of directional radiation patterns came to the rescue and enabled the growth of MW broadcasting. Today there are around 5000 AM stations operating in the MW band in North America.
What is a directional pattern?
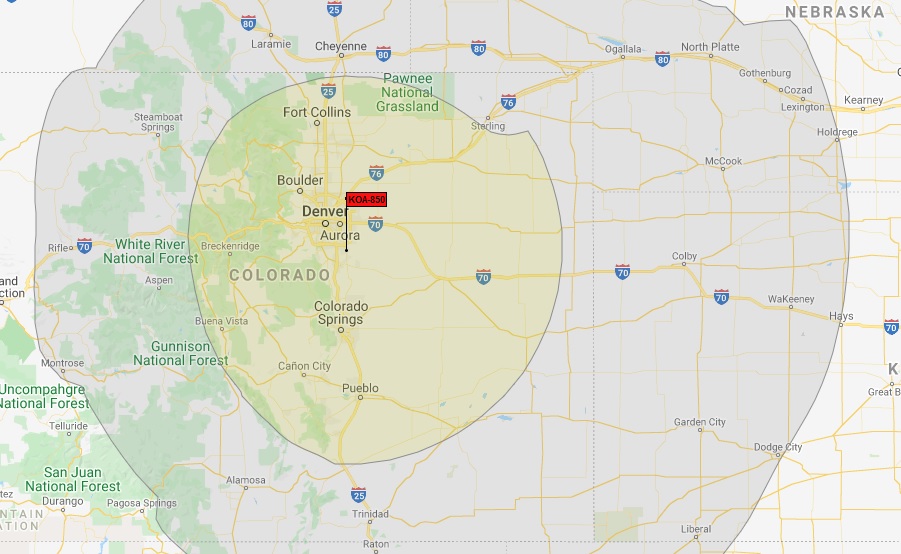
At its simplest, a broadcasting antenna radiates its signal equally in all directions like the diagram for KOA in Denver Colorado. In practice local terrain and obstructions can influence the real radiation pattern, making it not quite circular. Maps usually show two contours which mark the limit of strong signal and weak signal reception.
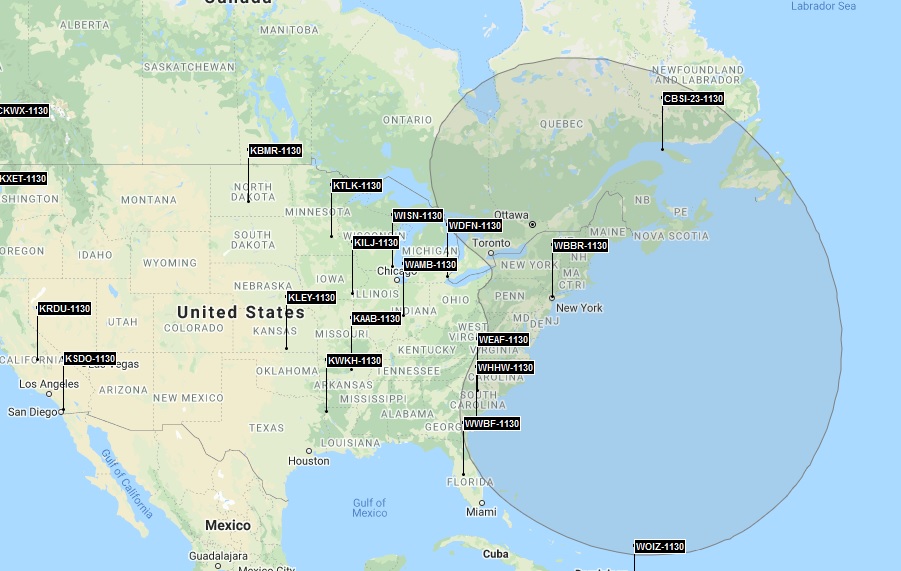
Directional radiation patterns involve more complicated antennas to generate a desired radiation pattern. An example is WBBR 1130kHz which at night beams most of its signal east to avoid causing co-channel interference west of New York. DXers in Europe benefit from this and the map shows why reception of WBBR is frequently possible on portable radios or car radios in the UK.
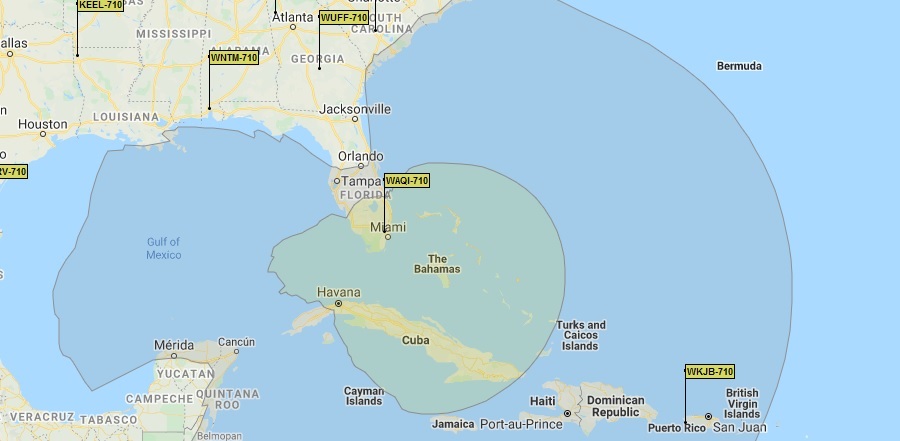
Other directional patterns are designed to target a specific audience. Although WAQI 710 is a Spanish language radio station licensed to Miami its radiation pattern reveals where its target audience really is located!
Impact on DXers
If you are DXing you might assume that what seems to be a high power station would be any easy catch. But the total radiated power is only half the story. What really matters is the amount of power actually being radiated towards your receiving antenna. There are examples of stations radiating 50000W in total which have radiation patterns that reduce the effective radiated power in certain directions to as little as 50W, whilst simultaneously beaming over 200kW effective radiated power in other specific directions.
Many broadcasters change their antenna radiation pattern between night and day (this often coincides with a change in transmitter power as well). Some even have a third pattern used during “critical hours”, i.e. during the transition between day & night.
You can take advantage of changes in power and changes in broadcast radiation pattern to hear a particular station – sometimes for only a brief period of time. But of course this is only possible if you have accurate up to date information at your fingertips.
Sometimes anomalies arise which can be of great interest to DXers. There are circumstances where a station fails to use the radiation pattern it is supposed to. For example a station might accidentally or deliberately use its daytime pattern at night. This is can create a short-lived opportunity for the dedicated listener to hear an otherwise inaudible station. These opportunities can be deliberate due to a pre-arranged DX test, or planned antenna maintenance. Or they can be unexpected as a result of equipment failure, storm damage or vandalism.
Data Source
In the USA fortunately the technical specification of every MW radio station and their antennas is made publicly available by the Federal Communications Commission (FCC). All this data is available online via the FCC website. However the data is not in a format that is helpful to the DXer.
Mapping tool
It’s one thing having data, but quite another turning it into something useful. We are pleased to say that Bill Scott has done a fantastic computer programming job to make this data valuable. He has created a tool called Radio Data MW (RDMW) which uses the FCC and other data to map the radiation pattern of every MW station in the USA and Canada. And then he has integrated this with Google Maps for your benefit.
That means for every MW channel in North America you can see a map showing the radiation pattern of every station. You can view the whole continent or zoom in to great detail. In fact you can zoom in and actually see the antenna masts!
In fact for every MW channel Bill has created two maps: daytime and nighttime supplemented by 44 maps showing critical hours. In total there are 280 maps.
Daytime maps
The daytime maps show expected ground-wave coverage patterns at two levels, out to the 1.0mV/m and 0.1mV/m field strength contours (60 dBu and 40 dBu respectively). These levels were chosen to closely match those which might be helpful to the MW DXer. For daytime signal maps, Radio Data MW generates a real pattern plot based on transmitter power, antenna array efficiency and directivity, ground conductivity and ground dielectric constant of the path to the receiver. Increased conductivity of water paths over the Great Lakes and the oceans are also accounted for. It is exceptional to find a program that takes all these factors into account.
Nighttime maps
Nighttime maps show expected skywave coverage patterns. These represent the standard SS+6 (sunset plus 6 hours, or approximately midnight Central Standard Time), 50% signal probability of 0.1mV/m (40 dBu) field strength. Note also that nighttime reception of signals out to and beyond the depicted pattern is very possible, and in fact quite likely for a skywave signal. The maps represent a signal strength at the fringe level. Bill chose this signal level to give a good representation of what is possibly received by most DXers on an average evening. For skywave signal maps, predicted signal levels are calculated in accordance with current FCC or ITU methods of recent years (1999 onward).
Other features
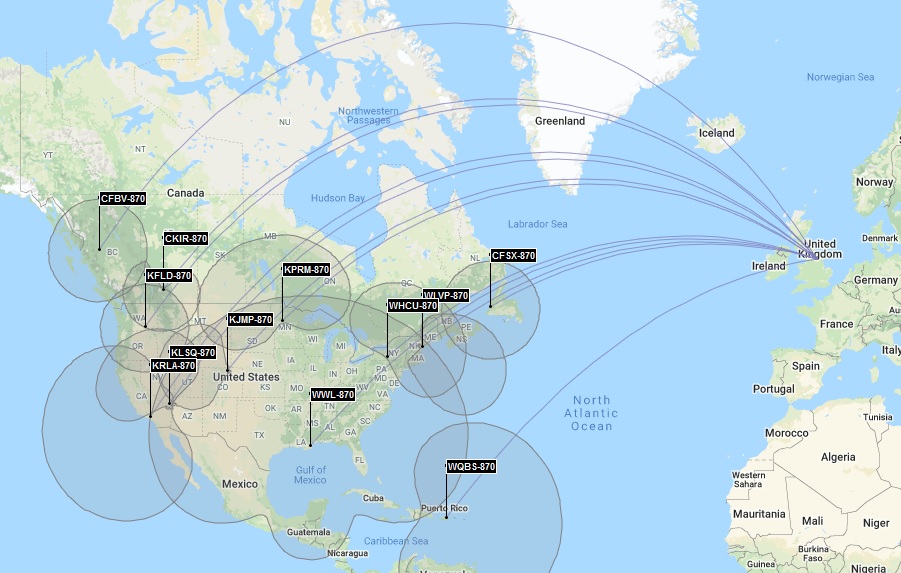
Bill has added a feature where you can trace a path on the map from transmitters to your listening post. This shows the great circle path that the signal would take and also reveals the relative signal strength radiating in your direction. And with a map at hand showing the traces you’ll quickly see which signals might be audible at your location. The example below shows how stations on 870kHz could propagate to the UK. A UK-based listener could easily see which stations might be affected by polar signal absorption and could also see where to point their receiving antenna for best reception.
We have created 6 regional editions in which a default receiving location has been pre-programmed to simplify ray tracing to your part of the world. However you can always enter any latitude and longitude to represent any receiving location and get the program to redraw the map for you. If you are more interested in coverage maps than ray tracing to a receiving location outside the USA, then you should opt for the US Edition because the continental US appears as the default map.
Furthermore, if you hover your mouse/pointer over any station flag pin it will show you the calculated great circle distance (km) from your listening post to the radio station’s antenna.
Download “Radio Data MW”
OCTOBER 2021 UPDATE: Please note that RDMW has been updated for 2022 and was published on 25th October. It has many more features and an expanded database of stations behind it. For full details and how to order the current Edition click the button below.
.